While many cyclists focus solely on distance and speed, I've discovered that tracking the right performance metrics can transform an ordinary ride into a precisely calibrated training session. As a cycling coach and data analyst, I'll show you how combining power output measurements, heart rate monitoring, and recovery tracking creates a thorough system for maximizing your workout effectiveness. Whether you're training for your first century ride or aiming to break personal records, understanding these essential metrics will help you build a structured approach that delivers measurable improvements in your cycling performance. Let's explore the tools and techniques that will elevate your training to the next level.
Some of the links in this article may be affiliate links. If you make a purchase through these links, we may earn a small commission at no extra cost to you. Thank you.
Key Takeaways
- Track power output using a power meter to measure wattage and calculate watts per kilogram for accurate performance assessment.
- Monitor heart rate zones during workouts to optimize training intensity and ensure targeted efforts in endurance, tempo, or threshold ranges.
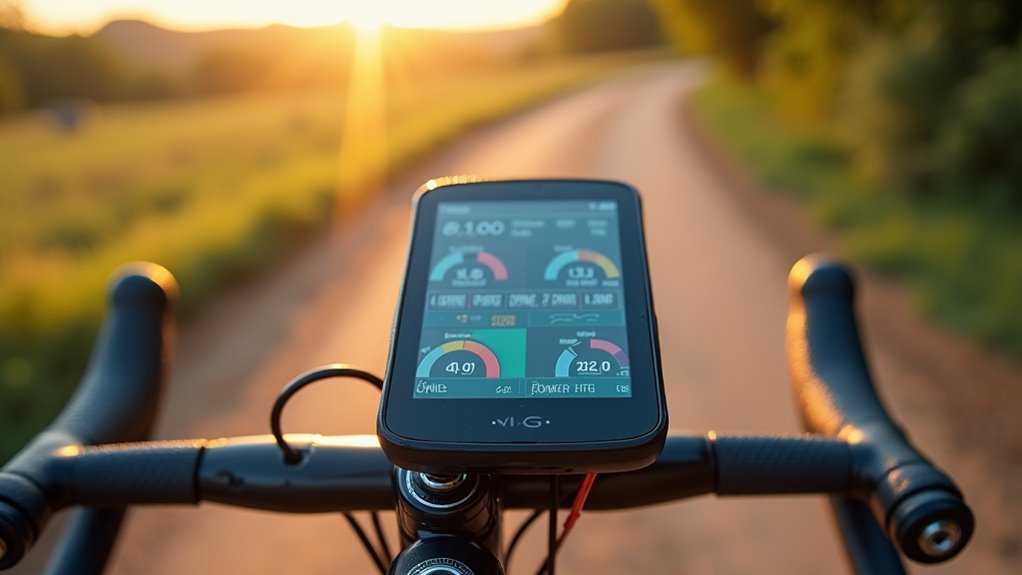
- Use GPS computers and cloud platforms to record speed, distance, and visualize performance trends over time.
- Calculate Training Stress Balance from Chronic and Acute Training Loads to prevent overtraining and guide workout intensity decisions.
- Implement systematic data collection and analysis through personalized dashboards to track progress and validate training effectiveness.
Understanding Power Output Fundamentals
Power output forms the cornerstone of modern cycling training and performance analysis.
I'll help you understand how power meters measure your effort through strain gauges that detect pedaling forces, combining this data with your cadence to calculate your actual power output in watts. Many cyclists choose pedal-based meters for easy bike swapping.
These measurements are transmitted wirelessly to your cycling computer via Bluetooth or ANT+ protocols, giving you real-time feedback with impressive accuracy of 2% or better.
When I evaluate cycling performance, I focus on several key metrics. Regular power profile tests help establish clear performance benchmarks.
Your average wattage tells us your sustained power, while watts per kilogram (w/kg) helps compare output across different rider weights.
I consider your Functional Threshold Power (FTP) – the maximum power you can maintain for 20 minutes – as a vital benchmark.
For context, a fit amateur cyclist might maintain 250-300 watts during an FTP test, while pros achieve remarkably higher numbers.
These metrics create a detailed picture of your cycling capability.
Whether you're a Cat 5 racer targeting 2.4-2.9 w/kg or aspiring to reach pro-level outputs of 5.6+ w/kg, understanding your power numbers is essential for tracking progress and setting realistic goals.
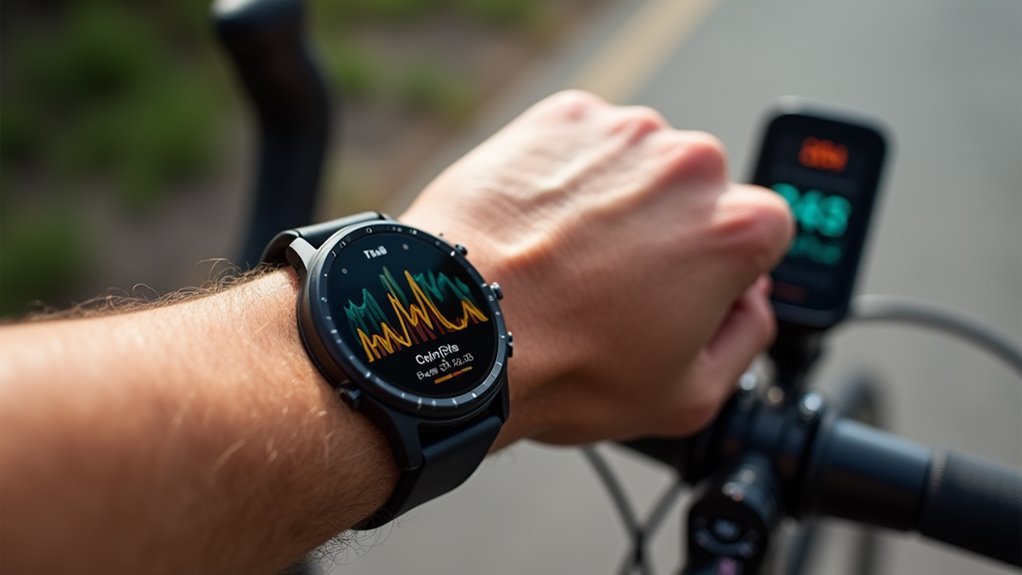
Heart Rate Zone Training
Heart rate zones revolutionize cycling training by providing clear intensity targets based on your maximum heart rate. I'll help you understand how to use these zones effectively to achieve your specific fitness goals, whether you're training for competition or general fitness. Exceeding max heart rate during intense cycling sessions can be dangerous and counterproductive to your training goals. The combination of energy systems training through different heart rate zones helps optimize both aerobic and anaerobic performance.
| Zone | % of Max HR | Primary Benefit |
|---|---|---|
| Recovery | 0-60% | Active recovery, builds base |
| Endurance | 60-70% | Fat burning, aerobic foundation |
| Tempo | 70-80% | Sustainable power, mental toughness |
To determine your zones, you'll need to find your threshold heart rate. I recommend performing two 8-minute efforts and multiplying the higher average heart rate by 0.93. Once you've established your zones, you can tailor your workouts to your goals. For weight loss, I suggest focusing on tempo and threshold zones, which maximize calorie burn without excessive fatigue. For performance improvements, I incorporate VO2 Max intervals at 90-95% of max heart rate.
Track your zones using a heart rate monitor during workouts, and adjust your training as your fitness improves. Remember to correlate your heart rate with your perceived exertion to guarantee you're training at the right intensity.
Essential Performance Tracking Tools
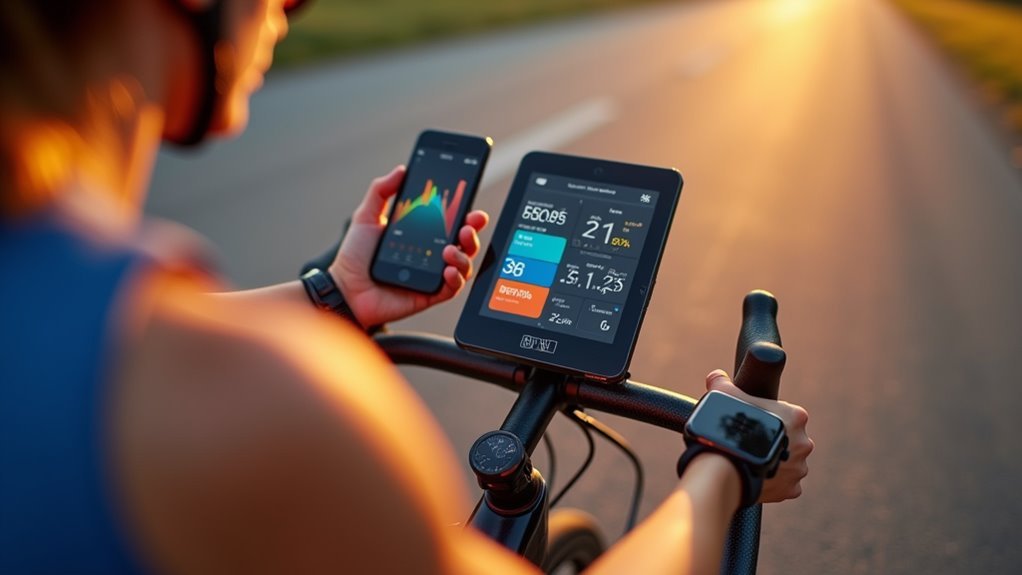
While heart rate zones lay the foundation for effective training, modern cyclists now have access to an impressive array of digital tools that transform raw data into actionable insights.
I recommend starting with a power meter, which provides the most reliable measurement of your cycling output. Combined with a GPS-enabled bike computer, you'll track not just watts but also speed, distance, and location in real-time. Modern platforms offer clean interface displays that make analyzing your metrics intuitive and efficient.
I've found that the real power lies in how you analyze this data. Using platforms that support multiple devices, you can create custom charts to visualize your performance trends. You'll want to pay special attention to your power output on similar segments over time – it's one of the clearest indicators of improvement. Proper nutrition and rest significantly impact these performance metrics.
The ability to export your data means you can dive deeper into your metrics or share them with a coach.
For structured improvement, I suggest linking your tracking tools with training plans. You can monitor your Functional Threshold Power (FTP), weight changes, and heart rate patterns while maintaining privacy over sensitive data.
When combined with automatic weather tracking, these tools help you make informed decisions about your training intensity and timing.
Training Load Management
The science of training load management forms the backbone of cycling performance optimization. I'll show you how to balance your training stress using key metrics that track both short-term and long-term adaptations. Understanding your data helps avoid overtraining syndrome and illness.
Your chronic training load (CTL) reflects your fitness foundation through a 42-day weighted average of your Training Stress Scores (TSS). Meanwhile, your acute training load (ATL) captures recent training stress over 7-10 days. The relationship between these metrics creates your Training Stress Balance (TSB), which I use to gauge your readiness for intense workouts. Research shows that high TRIMP scores don't necessarily translate to better performance outcomes.
I recommend implementing a structured approach with recovery weeks every 3-4 weeks. This timing isn't random – it's when your body needs to consolidate adaptations and prevent overtraining.
During these easier weeks, I suggest reducing intensity rather than stopping completely, following a stepladder approach to training stress.
You can choose between polarized, pyramidal, or block periodization models – they're all effective for trained cyclists.
What matters most is consistency in tracking your metrics and responding to what they tell you about your training status.
Recovery Metrics That Matter
Four critical recovery metrics guide every successful cycling program: recovery scores, heart rate variability (HRV), recovery duration, and training integration data.
I'll help you understand how each metric impacts your training effectiveness. Your recovery score, tracked through training software and daily mood ratings on a 1-10 scale, helps me assess your readiness for workouts.
I recommend monitoring your HRV each morning, as it's a powerful predictor of performance potential and recovery status. Higher HRV values typically indicate you're ready for intense training. Regular monitoring of your resting heart rate provides additional insights into your recovery status.
When it comes to recovery duration between intervals, I've found that 30-second rest periods lead to better power output and reduced fatigue. Research shows that mean power output improves 26% with 30-second recovery periods. You'll experience lower blood lactate levels and perceived exertion with these longer recovery windows.
I integrate these metrics with your training intensity and volume data to create a sustainable program. For instance, if you're training 10 hours weekly, I'll recommend 1-2 rest days to maintain balance.
Data Analysis Best Practices
Modern data analysis transforms cycling performance through systematic collection and interpretation of training metrics.
I've found that combining data from multiple sources, including fitness watches, speed sensors, and power meters, creates a thorough view of your training progression.
To maximize the value of your data, I recommend focusing on visualization tools that highlight key performance indicators. I use interactive dashboards to track my power output trends, training stress scores, and time spent in specific intensity zones. This allows me to spot patterns and identify areas needing improvement.
When analyzing your performance data, it's essential to reflect on external factors like weather conditions, nutrition, and sleep quality. I integrate these variables into my analysis to understand their impact on my cycling efficiency.
By tracking these metrics alongside performance data, I can make more informed decisions about training adjustments.
I suggest establishing a routine for regular data review. Compare your current performance against historical data to validate training effectiveness and adjust your plans accordingly.
Remember to focus on actionable metrics that directly relate to your cycling goals, whether they're competitive or recreational.
Customizing Your Training Dashboard
Building your personalized training dashboard marks a logical next step after mastering data analysis fundamentals.
I'll show you how to set up key metrics that matter most for your cycling progression, including speed, power, heart rate, and FTP measurements. These metrics create a thorough picture of your performance and help you track improvements over time.
You'll want to leverage the course builder tools to design custom rides and interval workouts.
I recommend starting with basic 4×6 minute intervals and gradually creating more complex training routes as you advance. Don't forget to add navigation cues to make your rides smoother and more focused.
The power of your dashboard lies in its visualization capabilities.
I suggest setting up power history charts and training load displays to monitor your progress effectively. You can also track time spent in different zones to make sure you're hitting your target intensities.
For seamless data management, configure your dashboard to sync with other fitness platforms and export data when needed.
If you're working with a coach, set up proper sharing permissions while maintaining privacy for sensitive metrics like power and heart rate data.
Frequently Asked Questions
How Often Should Power Meter Calibration Be Performed for Accurate Readings?
Just like checking your sundial, I recommend calibrating your power meter before every ride. Don't skip it – temperature changes and mechanical adjustments can affect accuracy during your cycling session.
Can Weather Conditions Significantly Affect Power Meter and Heart Rate Data?
Yes, I can confirm that weather notably impacts your data. Wind can alter power readings by up to 10%, while cold temperatures affect heart rate zones and may require more frequent power meter calibration.
What's the Best Time of Day to Measure FTP?
While morning riders might disagree, I recommend testing your FTP in late afternoon or early evening when your body temperature peaks and physical performance is naturally higher due to circadian rhythms.
How Do Different Bike Positions Impact Power Output Measurements?
I'll tell you that bike position directly affects your power measurements – more aerodynamic positions typically allow higher outputs, while upright positions reduce power transfer but offer more comfort.
Should Power Metrics Be Adjusted When Training at High Altitudes?
I'd definitely adjust your power metrics when training at altitude. Since you'll see roughly 1% power loss per 1,000 feet gained, recalibrating your FTP helps set realistic training targets.